New York Brand Power Rankings with Cultivated Media – June 2026
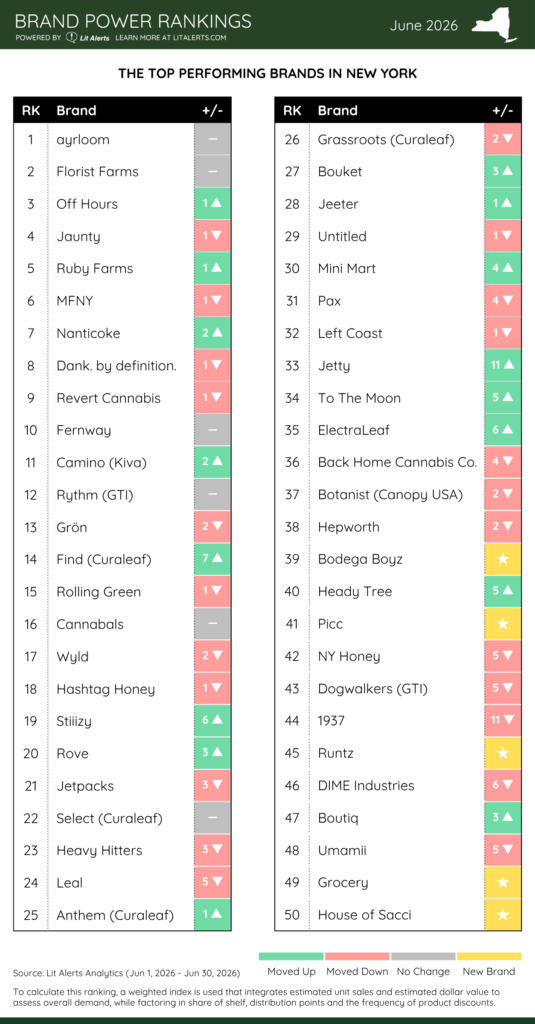
Comparing the newly released June 2026 data against May 2026 reveals a market undergoing massive structural changes. We are moving away from a period of quiet stability and entering an era of aggressive mid-tier churn, corporate portfolio adjustments, and high-impact cultural branding.
Beyond the Boroughs: Mapping Brand Dominance Across Upstate New York
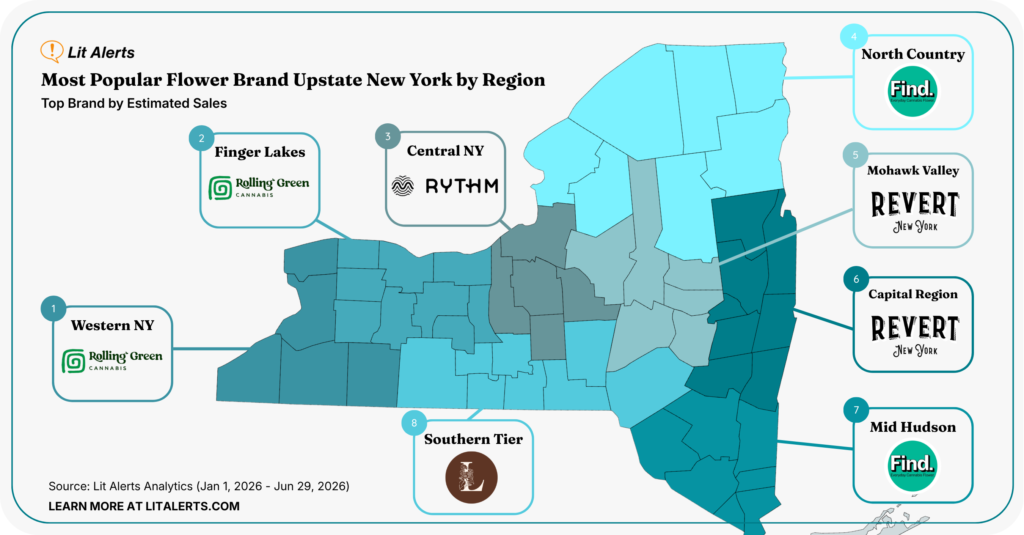
Following the overwhelming response to our NYC analysis, the team at Lit Alerts has expanded the lens. To give cultivators, brands, and retailers a complete macro-view of the market, we have analyzed estimated retail sales metrics across the vast and culturally distinct landscape of Upstate New York.
NYC Borough Cannabis Brand Leaders
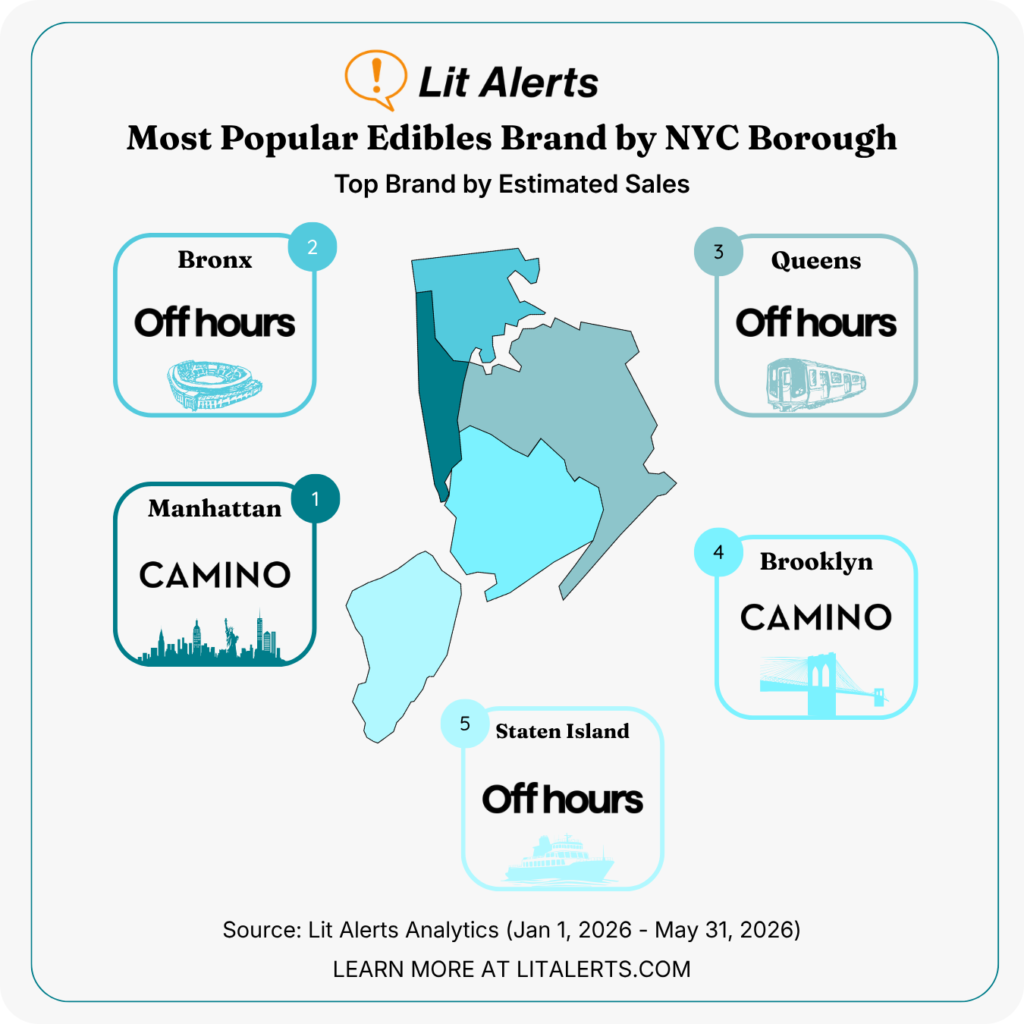
The New York City adult-use cannabis market is no longer a nascent experiment. Consumers across the five boroughs have developed distinct brand loyalties, shaped by local dispensaries, commuting patterns, cultural nuances, and pricing tiers.
The “Knowledge Gap” Holding Back Cannabis Concentrates
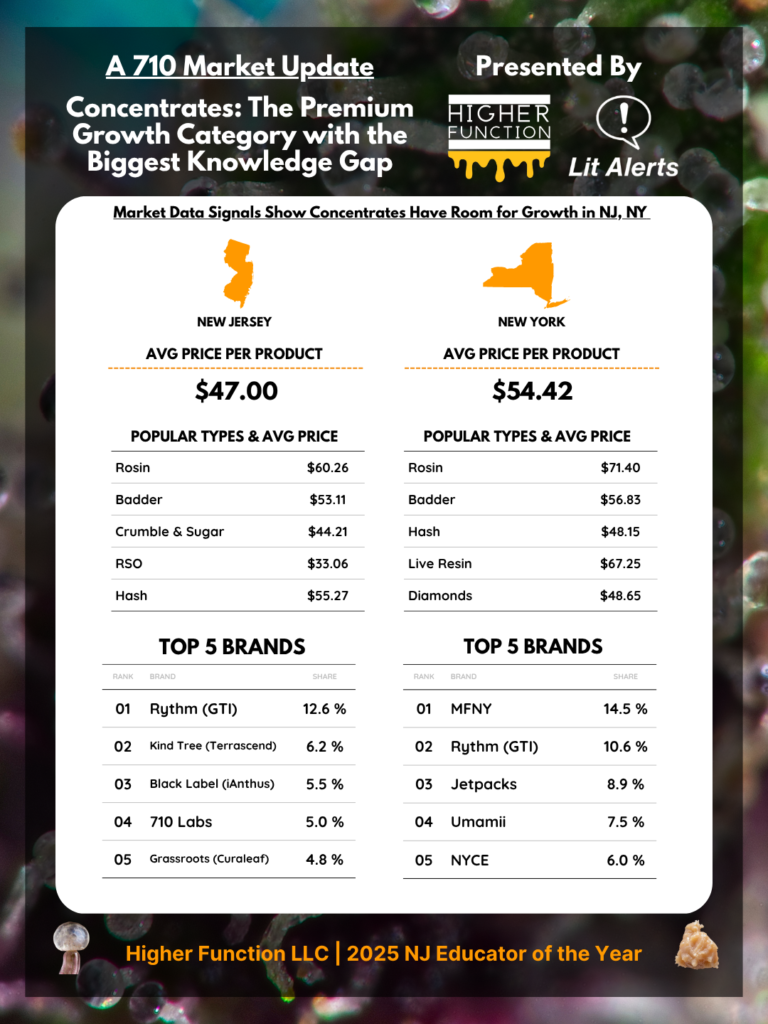
Ahead of the 7/10 Concentrates Holiday, data from New York and New Jersey reveals consumers are curious about concentrates, but knowledge remains the biggest barrier to adoption; Offers guidance to dispensaries looking to tap this key audience.
The Challenger Brands of Massachusetts – June 2026
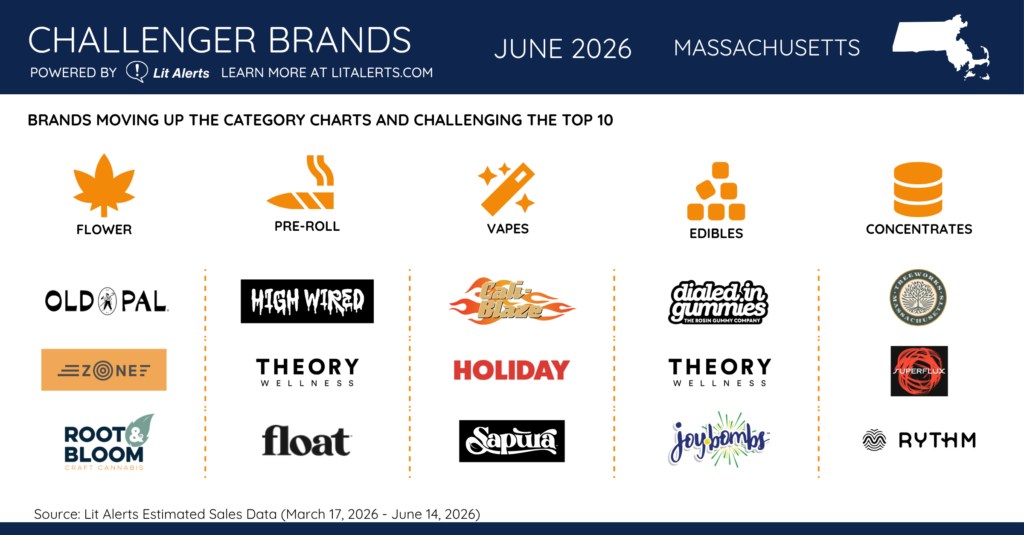
In the Bay State, while Multi-State Operators (MSOs) still wield immense corporate clout, entrenched regional independent powerhouses, hyper-focused local craft operators, and asset-light multi-state licensing brands are rapidly scaling the charts.
Inaugural Ohio Brand Power Rankings (May 2026)
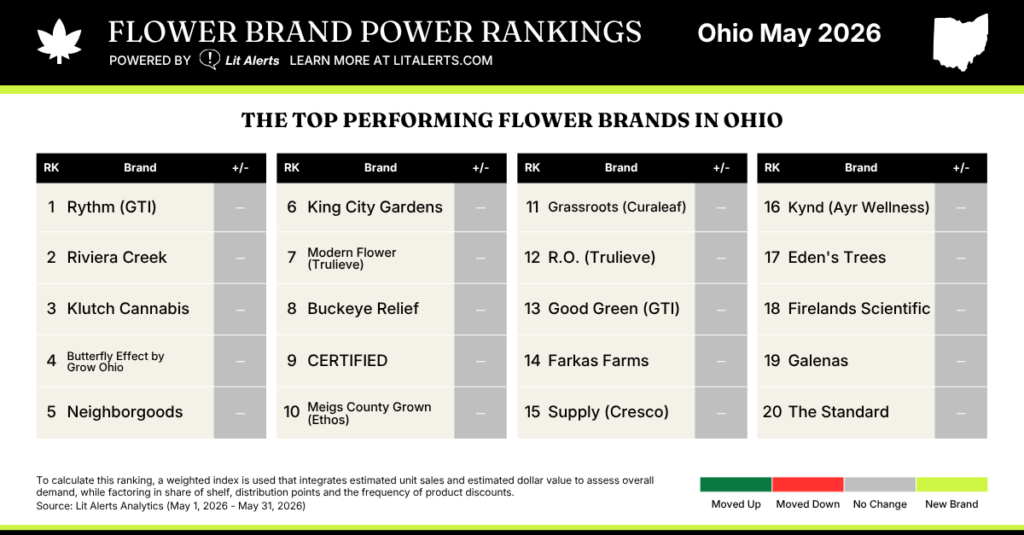
In the first edition of the Ohio Brand Power Rankings. Ohio-native brands like Certified, Riviera Creek and Klutch are successfully defending their home turf against massive multi-state brands like GTI’s Rythm.
The East Coast 8th Index – June 2026
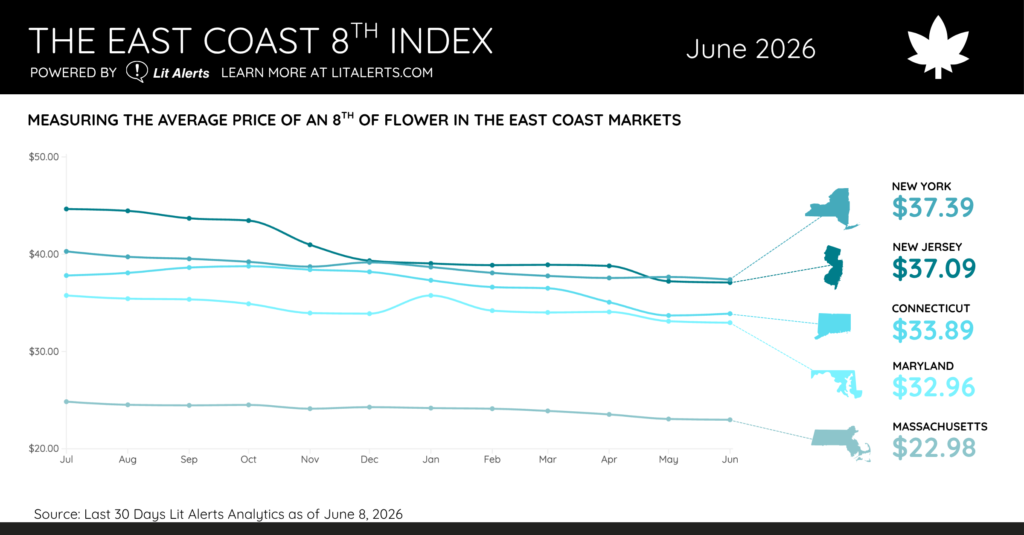
Four out of the five tracked states established new historical lows this month, demonstrating that lower retail price points are becoming standard market policy rather than temporary fluctuations.
New York Brand Power Rankings with Cultivated Media – May 2026
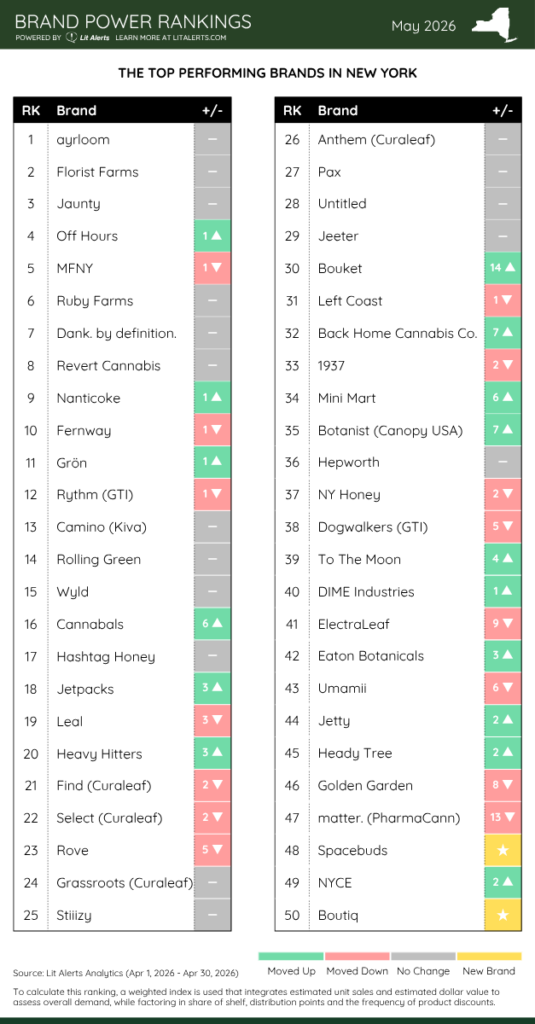
Compared to the turbulence and rapid shifts seen in early spring, the latest data reveals a stabilizing leaderboard, significant resistance to change among the market leaders, and a slow influx of new brand competitors that compete.
Independent Retailers Continue to Shape New Jersey’s Cannabis Market
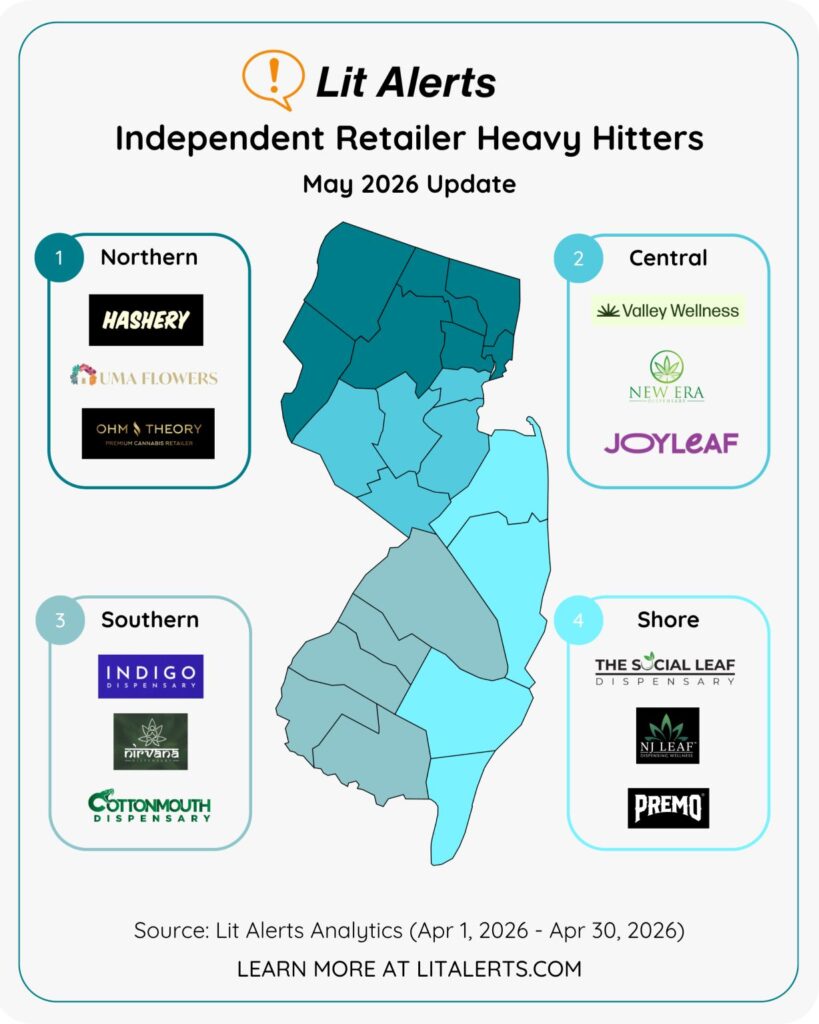
Independent cannabis retail isn’t just surviving in New Jersey, it is reshaping what an east coast market can look like. Locally owned dispensaries are competing side by side in key regional markets by running leaner, reacting faster, and building customer loyalty.
The Challenger Brands of Maryland – May 2026

In Maryland, the vast majority of the brands aggressively climbing the charts—as well as the Top 10 mainstays they are chasing—are backed or owned by Multi-State Operators (MSOs).