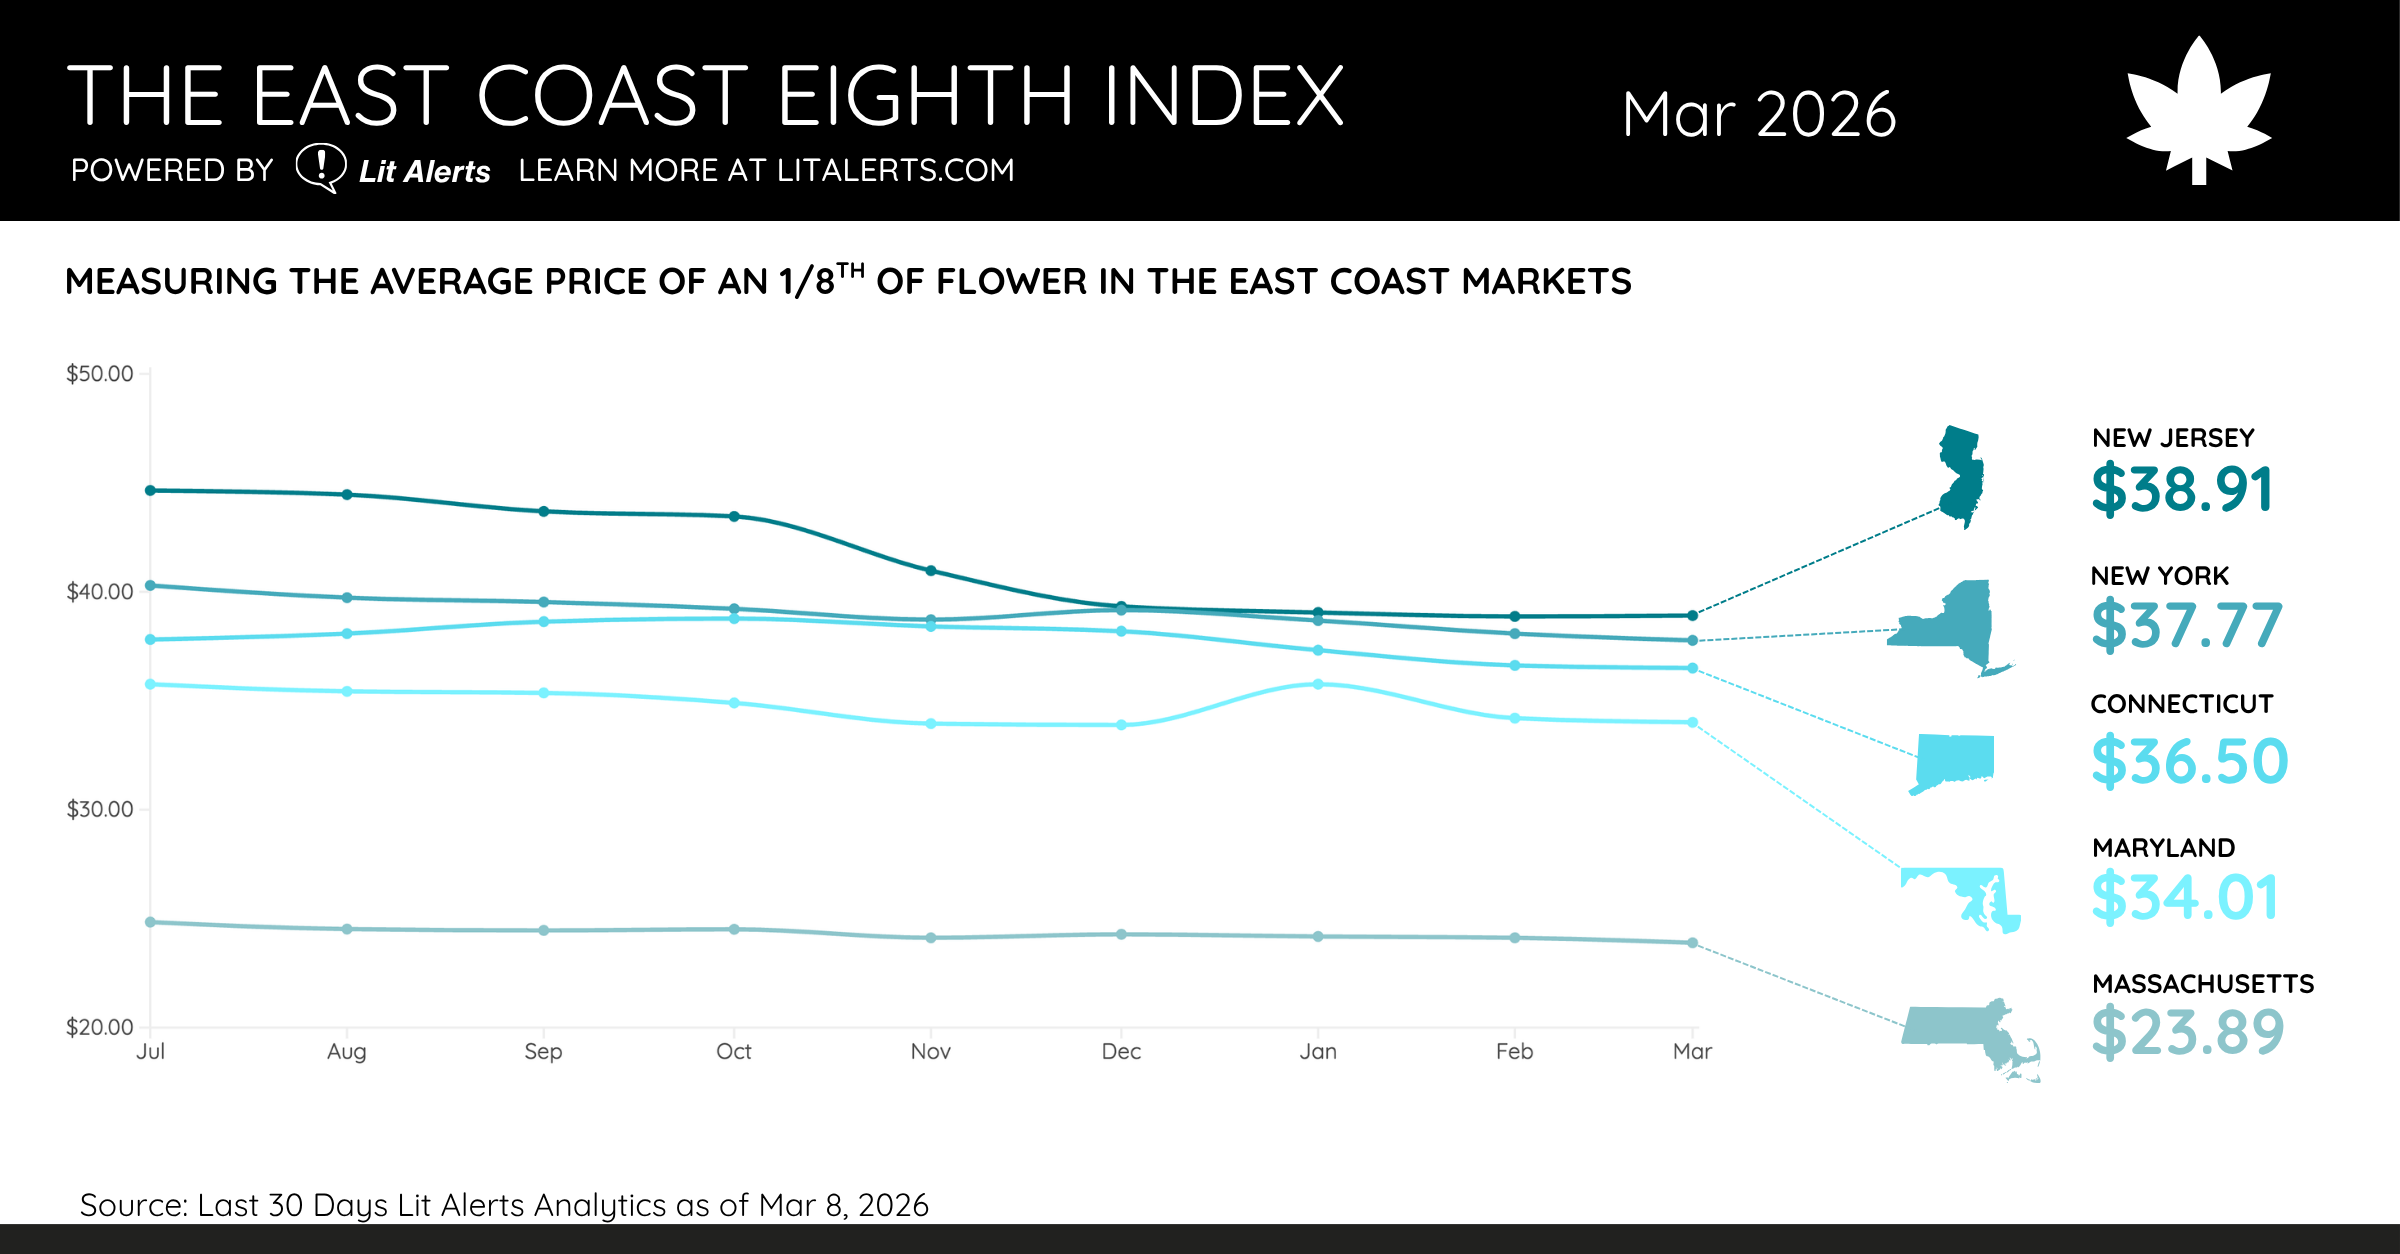
Welcome to the March 2026 edition of the East Coast Eighth Index, powered by Lit Alerts. Each month, Lit Alerts gathers, analyzes, and reports retail menu pricing across major legal cannabis markets along the Eastern Seaboard to establish a clear, data-driven benchmark for the industry’s most universally recognized unit: the 3.5g (“eighth”) package of flower.
By tracking menu dynamics across five core East Coast markets—New York, New Jersey, Connecticut, Maryland, and Massachusetts—our index provides operators, brands, and market analysts with transparent visibility into price movements, supply chain saturation, and regional market evolution.
As the East Coast market transitions into spring, the data from March 2026 reveals a continued downward drift across four of the five state markets, leading to brand-new, all-time historical price lows in New York, Connecticut, and Massachusetts.
Here is your comprehensive breakdown of the East Coast flower market for March 2026.
March 2026 Index Summary
New Jersey Holds Top Spot: New Jersey ($38.91) remains the highest-priced market in the index, ticking up by a modest $0.04 (+0.10%) month-over-month to stabilize after its February drop.
New York Hits Historic Low: New York ($37.77) declined $0.31 (-0.81%) from February, reaching a new all-time low in the history of the index.
Connecticut Continues Slide: Connecticut ($36.50) dropped $0.12 (-0.33%) from February, setting its own record floor.
Maryland Resumes Downward Trajectory: Maryland ($34.01) shed $0.19 (-0.56%) month-over-month, continuing to cool after its early-year price spike in January.
Massachusetts Breaks Below $24: Massachusetts ($23.89) fell $0.23 (-0.95%) from February, breaking below the $24 threshold for the first time in index history.
Three New All-Time Lows: Three out of five tracked state markets (NY, CT, and MA) established new historical price floors in March.
Regional Index Average: The five-state regional average declined by $0.16 month-over-month, falling from $34.38 in February to $34.22 in March.
Three Markets Reach Historic Lows: New York, Connecticut, and Massachusetts
The central story of the March 2026 dataset is the establishment of new historical price baselines in three distinct state markets. While price compression has been a consistent theme across the East Coast over the past eight months, March demonstrated that even relatively established markets are continuing to find lower price floors.
Expanded cultivation capacity and increasing retail store density across the region are maintaining steady downward pressure on retail menu pricing. As wholesale flower supply grows, dispensaries are increasingly relying on daily promotional pricing and competitive value tiers to capture consumer demand, driving down state-level average unit pricing for 3.5g packages.
New Jersey Stabilizes at the Top of the Regional Hierarchy
New Jersey remains the most expensive market tracked in the index, coming in at $38.91 per eighth in March. After dropping to $38.87 in February, the Garden State experienced a slight upward stabilization of +$0.04 (+0.10%) month-over-month.
Since reaching an index peak of $44.65 in July 2025, New Jersey flower prices have contracted by $5.74 (-12.86%). While New Jersey has absorbed significant long-term price erosion over the past eight months, its current $38.91 average maintains its position at the top of the regional pricing structure, sitting $1.14 above second-place New York.
New York Reaches a New Floor at $37.77
New York experienced the largest dollar decline in the region this month, dropping $0.31 (-0.81%) from February’s average of $38.08 to land at an all-time index low of $37.77.
Despite ongoing retail license expansion and increased product availability across the state, New York flower prices have demonstrated noticeable resistance to steep market crashes. Since July 2025 ($40.29), New York eighth prices have eroded by just $2.52 (-6.25%), representing one of the most gradual price decline curves in the region. However, March’s shift below $38 signals that Empire State operators are beginning to adjust retail margins to remain competitive in an increasingly crowded market.
Massachusetts Breaks the $24 Threshold
Massachusetts continues to serve as the ultimate benchmark for mature market pricing and supply chain efficiency on the East Coast.
In March, Massachusetts flower prices dropped $0.23 (-0.95%) month-over-month, falling from $24.12 in February to $23.89 per eighth. This marks the first time in the history of the index that Massachusetts has broken below the $24.00 mark.
Since July 2025 ($24.84), Massachusetts has operated within a highly compressed $0.95 trading band, illustrating how mature markets settle into predictable, low-margin price bands where extreme month-to-month swings are rare. Massachusetts remains the undisputed budget leader of the East Coast, sitting $10.12 below Maryland and $15.02 below New Jersey.
Mid-Tier Dynamics: Connecticut and Maryland Align
The mid-tier markets of Connecticut and Maryland both recorded steady price drops in March, further solidifying their positions between the premium tri-state markets and budget-friendly Massachusetts:
Connecticut: Connecticut flower prices dipped $0.12 (-0.33%) month-over-month, moving from $36.62 in February to a new historical low of $36.50 per eighth. Since peaking at $38.77 in October 2025, Connecticut has shed $2.27 (-5.86%) as retail inventory expands.
Maryland: Maryland dropped $0.19 (-0.56%) from February ($34.20) to reach $34.01 per eighth. After spiking to $35.76 in January 2026 due to short-term inventory rebalancing, Maryland prices have corrected downward over two consecutive months, returning close to its all-time floor of $33.89 recorded in December 2025.
Long-Term Price Erosion (July 2025 – March 2026)
Looking at cumulative performance over the eight-month period from July 2025 through March 2026 highlights the ongoing pace of regional price compression:
New Jersey: -12.86% total contraction ($44.65 down to $38.91)
New York: -6.25% total contraction ($40.29 down to $37.77)
Connecticut: -5.86% total contraction ($38.77 peak down to $36.50)
Maryland: -4.89% total contraction ($35.76 peak down to $34.01)
Massachusetts: -3.82% total contraction ($24.84 down to $23.89)
New Jersey continues to lead all tracked states in overall percentage drop from its peak, while Massachusetts and Maryland exhibit the lowest overall percentage volatility over the same timeframe.
It’s important to note that this analysis focuses on the most popular flower package as a proxy for broader pricing trends.
For more pricing info and comprehensive market analytics, schedule a demo or sign up for a 30-day free trial to Lit Alerts today.