As we cross into the second half of 2026, the data from July reveals a landscape defined by significant price compression, historic market lows, and fascinating micro-shifts in regional pricing tiers. Consumers are seeing unprecedented purchasing power, while operators are being forced to navigate increasingly thin margins and highly competitive retail shelves.
Here is our comprehensive breakdown of the East Coast flower market for July 2026.
July 2026 Index Summary
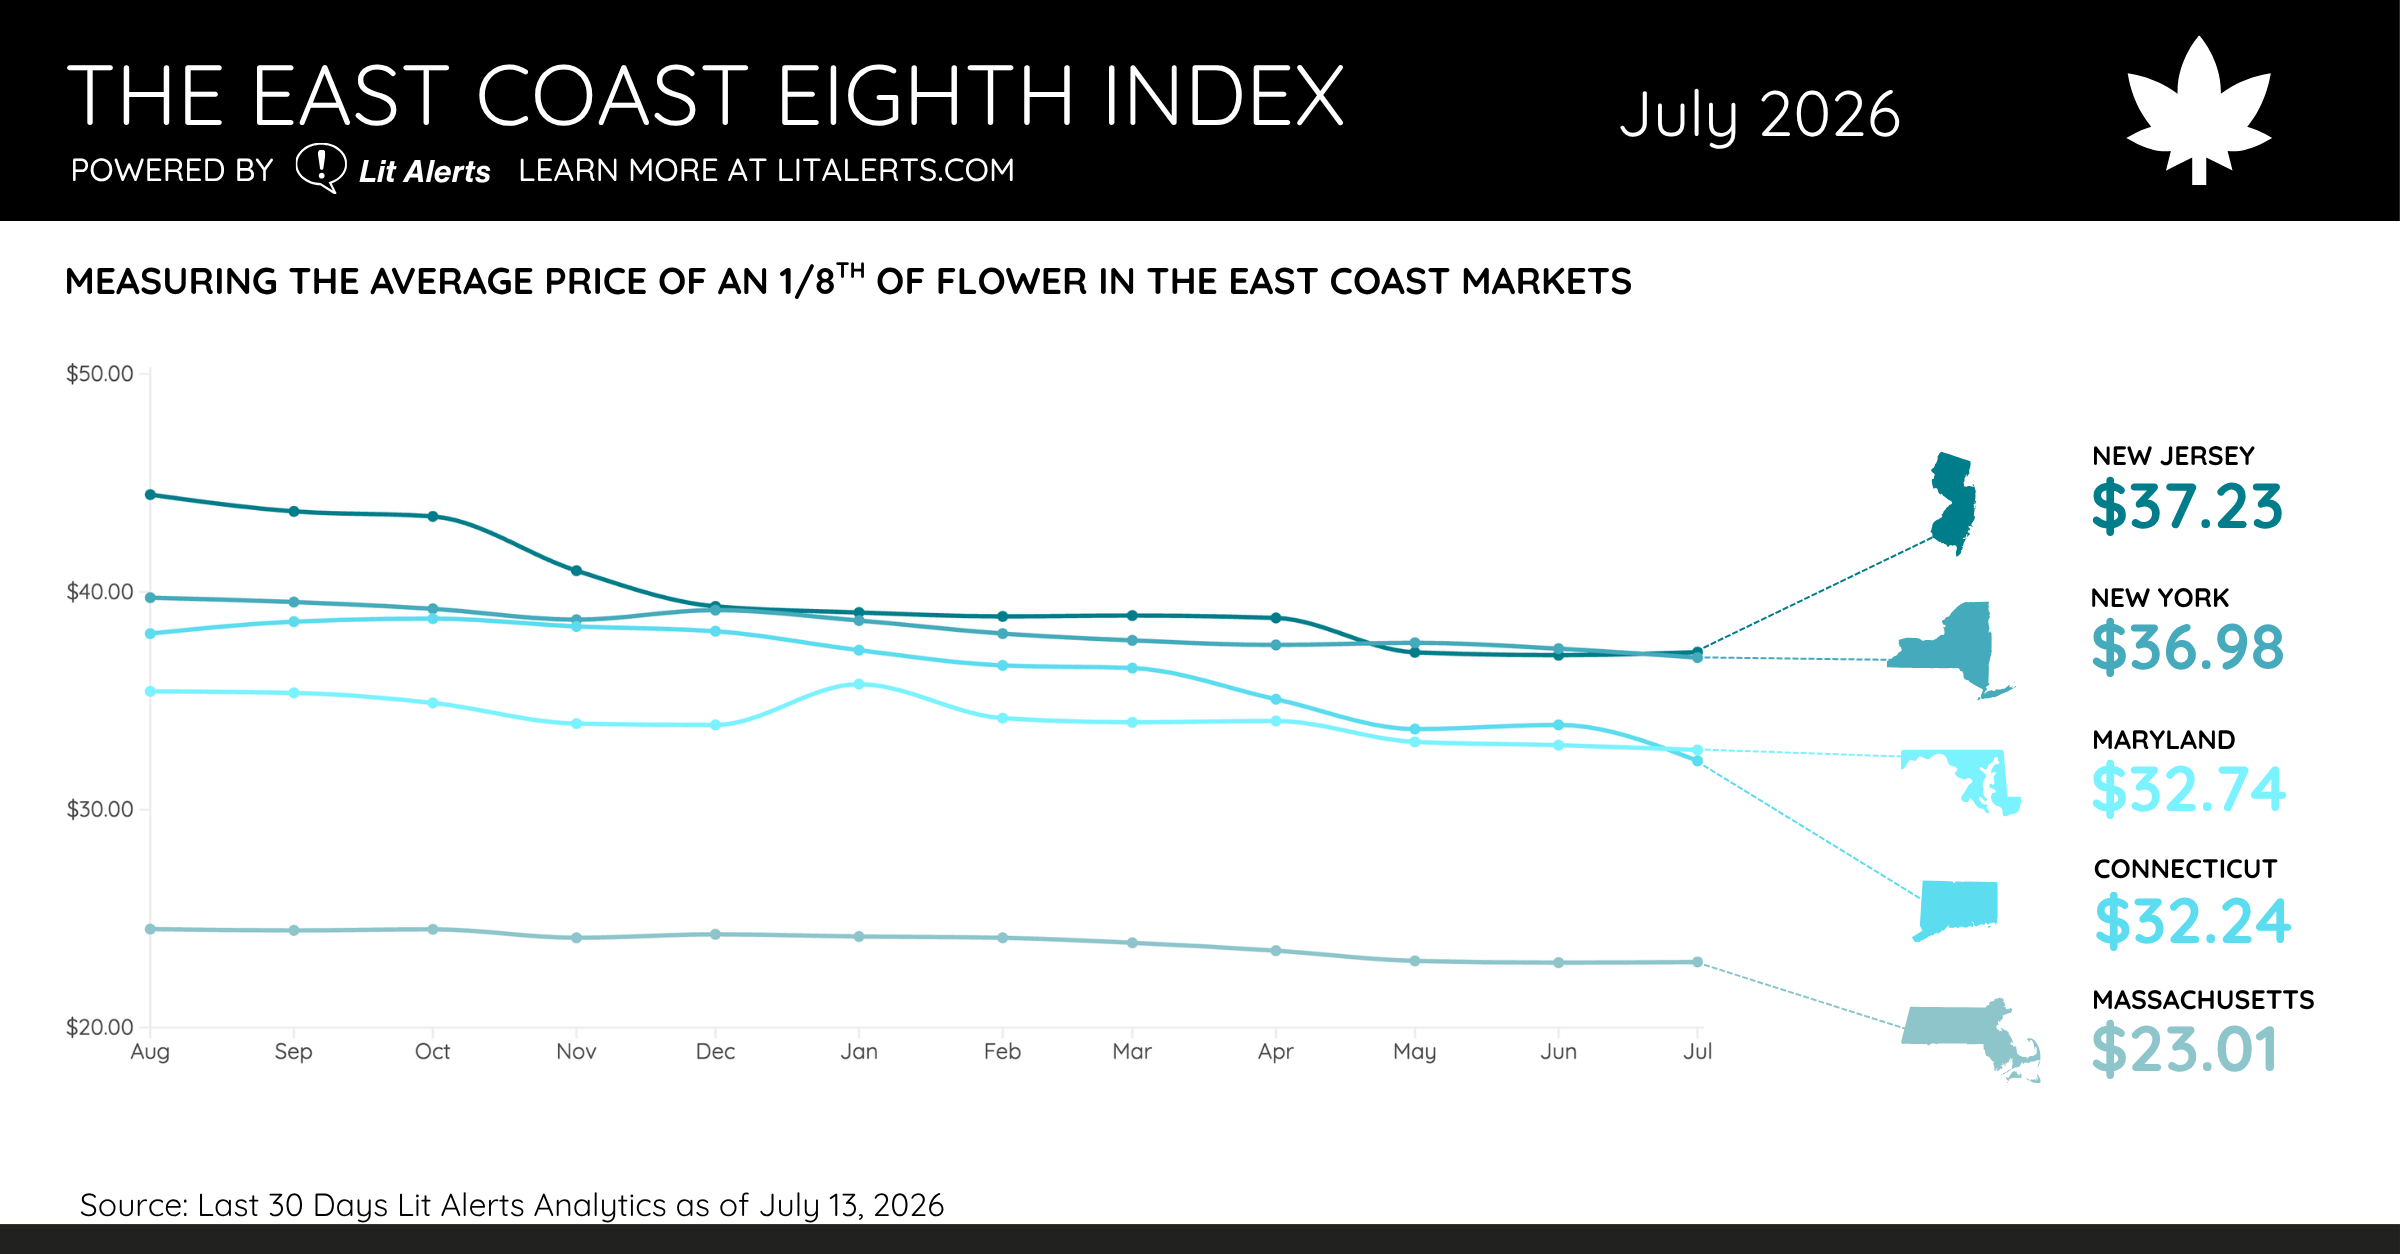
New Jersey reclaims the top spot: After months of tight competition with its neighbor across the Hudson, New Jersey ($37.23) is officially the most expensive market tracked in the index this month, defying broader regional trends with a slight upward tick.
Widespread All-Time Historic Lows: Consumers in New York ($36.98), Maryland ($32.74), and Connecticut ($32.24) are enjoying the cheapest flower on record, with all three states hitting brand-new historic lows in the life of our index.
Connecticut’s Dramatic Correction: Connecticut experienced the most drastic month-over-month shift in the region, plunging by an incredible $1.65 to distance itself from the premium-priced tier and securely anchor itself in the middle of the pack.
Massachusetts Maintains the Floor: The Bay State remains the undisputed budget champion of the East Coast, holding virtually flat at a low $23.01 per eighth, demonstrating the price consistency of a fully saturated and mature market.
Regional Averages Continue to Fall: The overall East Coast Eighth Index average across all five states sits at $32.44 for July, representing a cumulative regional drop of $0.42 from June’s average of $32.86.
Record-Breaking Market Corrections: The Era of Historic Lows
The overarching narrative for July 2026 is an acceleration of the “race to the bottom” in retail pricing. Three out of the five states tracked in the index achieved brand-new, all-time historic lows this month. This indicates that the downward pricing pressure we have been observing throughout late 2025 and early 2026 was not a mere seasonal fluctuation, but rather a structural realignment of the East Coast cannabis economy.
As more cultivation facilities come online, canopy square footage expands, and retail dispensary licenses continue to be issued across these regions, the basic laws of supply and demand are asserting themselves. The artificial price inflation that often categorizes new adult-use markets, born out of supply bottlenecks and regulatory lag, is officially fading into the rearview mirror for a majority of the eastern seaboard. The new standard market policy is one of highly compressed price tiers, where operators must rely on volume, brand loyalty, and operational efficiency rather than premium markup
Connecticut’s Dramatic Plunge
The most eye-catching development in the July 2026 data is undoubtedly the price action in Connecticut. Last month, Connecticut flower was sitting at a relatively comfortable $33.89 per eighth. Fast forward to July, and that average has plummeted to a historic low of $32.24. This represents a staggering month-over-month drop of $1.65.
To put this into historical perspective, Connecticut reached its peak index pricing back in October 2025, when an eighth averaged a hefty $38.77. For much of late 2025, Connecticut operated as a premium market, tracking closely behind New York and New Jersey. However, over the past nine months, we have seen aggressive and continuous price erosion in the Constitution State. The sudden $1.65 drop this month suggests a potential capitulation event among retailers, likely driven by a sudden influx of wholesale supply hitting the market simultaneously, forcing dispensaries into heavy promotional discounting to clear inventory space. Connecticut has now firmly decoupled from the NY/NJ pricing tier and is trading in lockstep with Maryland.
New York Breaks Below the $37 Threshold
Despite having a massive population and a rapidly expanding legal retail footprint, its legal prices have remained stubbornly high, partially due to the complexities of its rollout and the persistent competition from its unregulated gray market. However, July 2026 marks a watershed moment for the Empire State.
For the first time in the history of the index, New York’s average eighth price has broken below the $37 threshold, landing at a historic low of $36.98. This is a $0.41 drop from June’s average of $37.39. While New York is still the second most expensive market on the East Coast, the data shows that it is no longer immune to the broader regional forces of price equalization. Since hitting its all-time high of $39.73 in August 2025, New York has shed nearly $2.75 off its average eighth. As licensed retail infrastructure continues to scale up and legacy operators transition into the legal framework, we can expect New York to continue its slow, steady descent toward the regional mean over the coming quarters.
The New Jersey Anomaly: Slight Rebounds in a Downward Trend
New Jersey presents the most interesting contrarian narrative in July’s dataset. While the rest of the East Coast experienced notable price drops, New Jersey actually saw prices increase, ticking up by $0.14 from last month’s historic low of $37.09 to land at $37.23. This slight upward nudge was enough to push New Jersey past New York, making it the most expensive cannabis market on the East Coast for July 2026.
New Jersey’s historical data reveals a market that is highly reactive and prone to volatility. Back in August 2025, New Jersey was the absolute peak of premium pricing, boasting a staggering high of $44.46 per eighth. The market subsequently underwent a massive correction, dropping more than $7 in less than a year to hit its floor last month. This month’s $0.14 increase shouldn’t necessarily be interpreted as a return to premium pricing, but rather a temporary stabilization, a “dead cat bounce” in market terms, as retailers attempt to find the absolute floor where consumer demand and operator profitability meet.
Massachusetts and the Predictable Floor of Market Maturity
If you want to look into the crystal ball and see the future of the East Coast cannabis market, look no further than Massachusetts. As the oldest and most mature adult-use market in our index, Massachusetts serves as the ultimate predictive model for supply chain saturation and retail optimization.
In July 2026, Massachusetts held remarkably stable, registering a microscopic month-over-month increase of just $0.03, moving from $22.98 in June to $23.01 today. The Bay State continues to define the absolute efficiency floor for the region. The data tells a clear story: once a market reaches a certain level of maturity, price declines eventually decelerate and flatline. Dramatic month-to-month swings evaporate, replaced by a highly predictable, low-margin trading band. Since August 2025, Massachusetts has only fluctuated within a narrow $1.50 window, hovering comfortably in the $23 to $24 range. This is the destination that New York, New Jersey, Maryland, and Connecticut are all inevitably marching toward.
Looking Ahead: Strategic Implications for Brands and Retailers
The data from July 2026 provides a stark warning and a clear roadmap for operators on the East Coast.
For Brands: The days of relying on regional scarcity to drive premium flower pricing are coming to an end. As prices inevitably march toward the Massachusetts floor, brands must pivot their strategies toward building unshakeable consumer loyalty, reducing their cost of goods sold (COGS), and optimizing their genetics to ensure maximum yield. If a brand in New York or Connecticut cannot sustain profitability at a $32 price point today, they will struggle to survive when the market reaches $25 tomorrow.
For Retailers: Dispensary operators must prepare for a high-volume, lower-margin reality. Connecticut’s $1.65 drop this month is a prime example of how quickly local market conditions can force your hand on the pricing sheet. Retailers should be utilizing data analytics to track local competitor discounting and aggressively managing their wholesale purchasing to ensure they aren’t caught holding overpriced inventory as the market drops out from underneath them.
It’s important to note that this analysis focuses on the most popular flower package as a proxy for broader pricing trends.
For more pricing info and comprehensive market analytics, schedule a demo or sign up for a 30-day free trial to Lit Alerts today.